Hi! I am Dominik Jäckle.
I work as a Data Scientist at the BMW Group. Prior to that, I completed my PhD in Interactive Data Analysis and Visualization in the group of Prof. Daniel Keim at the University of Konstanz. I am passionate about high-dimensional data analysis, the development of advanced geospatial visualization techniques, and the communication of abstract visualization concepts. email
email twitter
 google scholar
 linkedin
News
Research and Projects
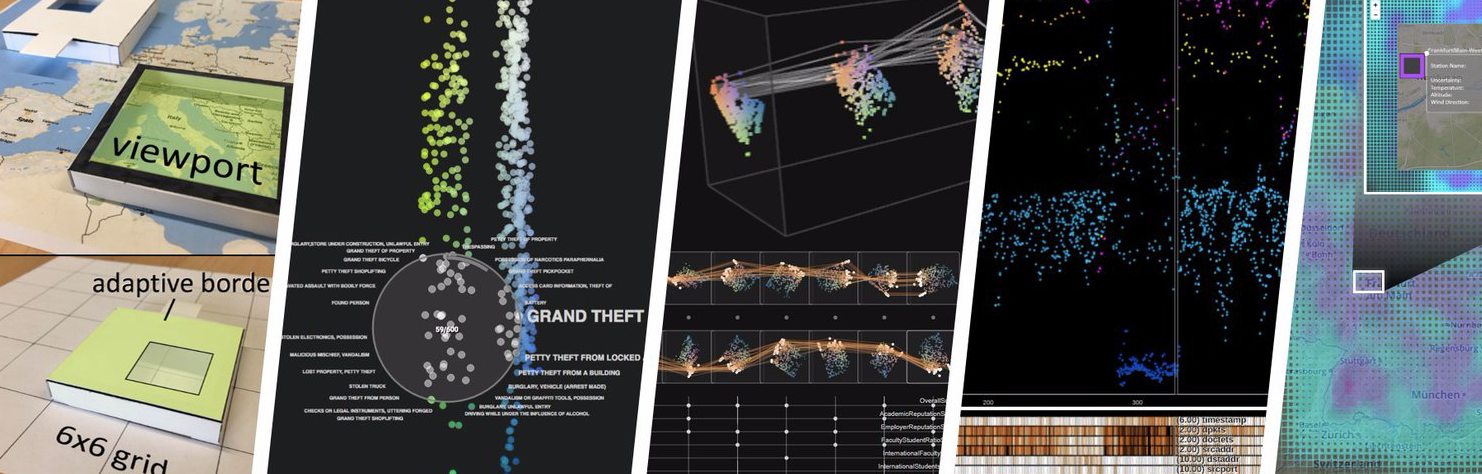
My passion centers around the concept of Interactive Visual Analysis - short Visual Analytics (VA). The overarching goal of VA is to integrate the power of automatic data analysis and interactive methods to enable knowledge generation. Visualization, thereby, plays a key role in presenting information; it is capable of making patterns salient, which may not be identified by looking at statistics only. In the era of Big Data, we process and present vast amounts of heterogeneous data in constant pursuit of insight. A main challenge in understanding such complex data is to identify, interpret, and navigate relevant discernible areas (patterns) such as clusters, outliers, or correlations. During my PhD, I addressed this challenge and developed novel methods to make sense of large sets of heterogeneous data. Following, you may get an impression of my work. I collected some projects as well as relevant publications.
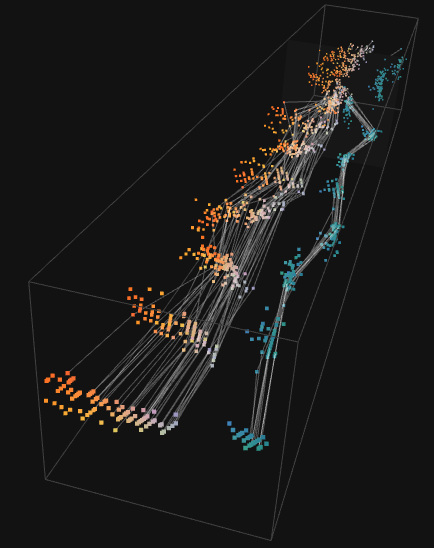
Pattern Trails
A novel method for identifying and interpreting patterns across multivariate subspaces.


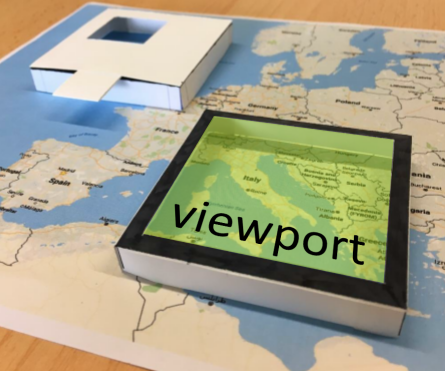
Topology-preserving Off-screen Visualization
Study of off-screen visualization regarding the preservation of the data space and the projection strategy when navigating.

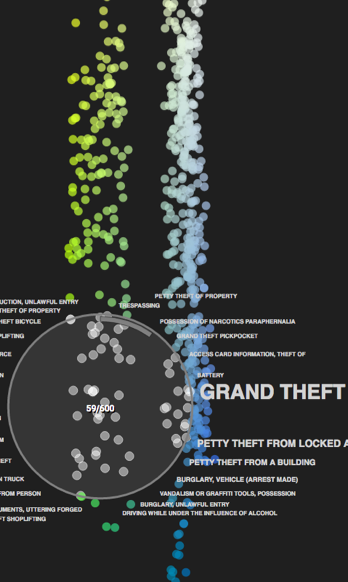
2D Colormaps JS Plugin
Easily encode the color of data points in scatterplots using a 2D colormap. Changes in the data will be easier to understand.

Interpretation of DR
Study of domain experts who are not trained in interpreting advanced statistics in a visual form. See the blog post.