2D Colormaps Javascript Plugin
2D Colormaps
This plugin allows you to encode two-dimensional information with color based on a 2D colormap. Examples include scatterplots of multivariate projections or the visual representation of Self-Organizing Maps. Try it with a random scatterplot example:| Data | Result Background: | |
 |
This plugin is based on the work of Steiger et al.
Explorative Analysis of 2D Color Maps
Steiger, M., Bernard, J., Mittelstädt, S., Hutter, M., Keim, D., Thum, S., Kohlhammer, J.
Proceedings of WSCG (23), 151-160, Eurographics Assciation, Vaclav Skala - Union Agency, 2015
Steiger, M., Bernard, J., Mittelstädt, S., Hutter, M., Keim, D., Thum, S., Kohlhammer, J.
Proceedings of WSCG (23), 151-160, Eurographics Assciation, Vaclav Skala - Union Agency, 2015
Basic Usage
Integrate the color2D.js file:
<script src="color2D.js"></script>
To set a colormap, use the setColormap() function. This function needs to be called in order to use the colormap.
Note, that the method expects a callback function which will executed after the corresponding colormap is loaded.
After having loaded the colormap, you can use the getColor() function, which returns a RGB array [r, g, b] in the range [0;255].
Color2D.setColormap(Color2D.colormaps.BREMM, function() {
var rgb = Color2D.getColor(x, y);
});
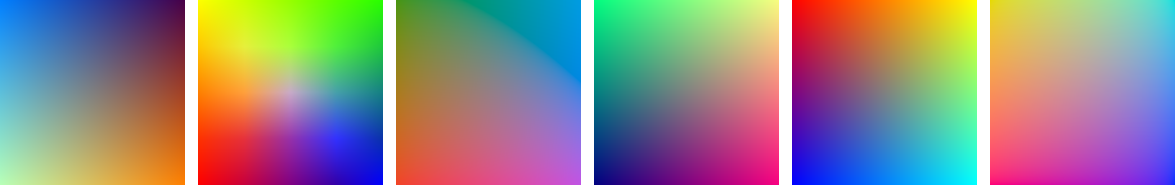
So far, the following colormaps are supported:
var rgb = Color2D.getColor(x, y);
});
Color2D.colormaps.BREMM;
Color2D.colormaps.SCHUMANN;
Color2D.colormaps.STEIGER;
Color2D.colormaps.TEULING2;
Color2D.colormaps.ZIEGLER;
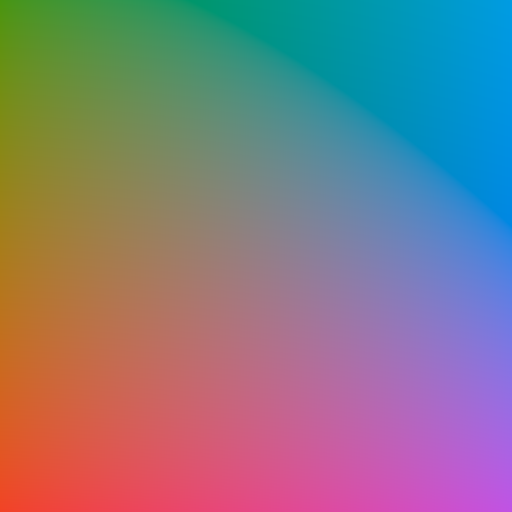
Feel free to define your own 2D colormap and load it as a PNG. Therefore, you have to set the path to and the dimensions of the PNG file.
Color2D.colormaps.SCHUMANN;
Color2D.colormaps.STEIGER;
Color2D.colormaps.TEULING2;
Color2D.colormaps.ZIEGLER;
Color2D.colormaps.NEW_COLORMAP = "$path_to_png$.png";
Color2D.dimensions = {width: 512, height: 512};
Per default, Color2D expects your data to be feature scaled within the range [0,1].
However, you can also change the range according to your data:
Color2D.dimensions = {width: 512, height: 512};
Color2D.ranges = {x: [0,1], y: [0,1]};
Download
Zip Archive (latest stable version): Color2D.zip GitHub Repository: https://github.com/dominikjaeckle/Color2DLicense
This plugin is licensed unter the Apache 2.0 License
Copyright © 2017 Dominik Jäckle